Posts

An Introduction to Statistical Learning - in Python
Image
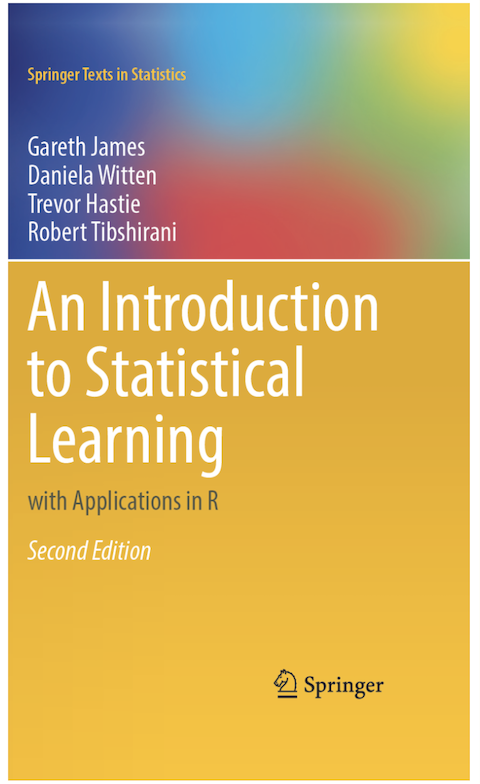
 The day we have all been waiting for is here!  The authors of  An Introduction to Statistical Learning with Applications in R   have finally launched the Python version of the book.   I am a big fan of this material, as well as the FREE online course made available by the authors (you can find it in here ). Honestly, there is no better introduction to Machine Learning with such a solid footing in statistics as this one.  The book contained exercises and examples in R, and now they just released a Python version of it!!! Chapter 10, on Deep Learning, was actually slightly changed to use PyTorch instead of Tensorflow (as it was done in the previous R version).  When I was studying with this book, I implemented a Tensorflow Python version of the labs and exercises they made available in R. If you are curious and wants to check the Tensorflow Python version of the Deep Learning chapter you can find it in my github .

Linux/POSIX commands that every Data Scientist should know

Sometimes, we face the challenge to work on legacy projects or systems that have very little documentation if any. I see a lot of data scientist struggling to locate themselves in these projects, so I decided to write here a few very useful and basic Linux/POSIX compliant commands that every data scientist/engineer/programmer should know (imho).   First remember that you can always type $ man command                                                                                                   ...

Top 5 Best Data Science and Machine Learning Courses

New Data Science enthusiasts usually wonder what are the what are the best resources to best master this area. I am a huge fan of online courses (specially if they are free 😆) and decided to share my top 5 favorite ones. All courses below should have their main content available for free, so you can learn Machine Learning without investing too much! Statistical Learning             This course from Stanford University, taught by  Trevor Hastie and  Robert Tibshirani is an absolutely  amazing introduction to Machine Learning .  You might have heard about Prof. Tibishirani for being responsible for developing the Lasso method.  The classes are a great mix of practical intuition and theoretical concepts. Besides the Professors are funny and adorable (if you don't mind me saying).  Applied Machine Learning in Python           Here we have a much more practical introduction to Machine Learning an...

Apache Hadoop Admin Tricks and Tips

In this post I will share some tips I learned after using the Apache Hadoop environment for some years, and  doing many many workshops and courses. The information here considers Apache Hadoop around version 2.9, but it could probably be extended to other similar versions. These are considerations for when building or using a Hadoop cluster. Some are considerations over the Cloudera distribution. Anyway, hope it helps!  Don't use Hadoop for millions of small files. It overloads the namenode and makes it slower. It is not difficult to overload the namenode. Always check capability vs number of files. Files on Hadoop usually should be more than 100 MB. You have to have a 1 GB of memory for around 1 million files in the namenode. Nodes usually fail after 5 years. Node failures is one of the most frequent problems in H adoop . Big companies like facebook and google should have node failures by the minute. The MySQL on Cloudera Manager does not have redunda...

BigData White Papers

I don't know about you, but I always like to read the white papers that originate OpenSource projects (when available of course :) ). I have been working with BigData quite a lot lately and this area is mostly dominated by Apache OpenSource projects.  So, naturally (given the nerd that I am) I tried to investigate their history. I created a list of articles and companies that originated most BigData Apache projects. Here it is! Hope you guys find it interesting too. :) Apache Hadoop  Based on: Google MapReduce and GFS  Papers: https://static.googleusercontent.com/media/research.google.com/en//archive/mapreduce-osdi04.pdf https://static.googleusercontent.com/media/research.google.com/en//archive/gfs-sosp2003.pdf Apache Spark   Created by: University of California, Berkeley  Papers:  http://people.csail.mit.edu/matei/papers/2012/nsdi_spark.pdf http://people.csail.mit.edu/matei/papers/2010/hotcloud_spark.pdf http://peo...

Deep Learning, TensorFlow and Tensor Core

Image
I was lucky enough to get a ticket to the Google I/O 2017 on a Google Code Jam for Women  (for girls that don't know, Google has some programming contest for women and the best classified win tickets to the conference). One of the main topics of the conference was for sure its new Deep Learning library TensorFlow . TensorFlow is Google's OpenSource Machine Learning library that runs both on CPU and GPU. Two very cool things were presented at Google I/O:  TPU (Tensor Processing Unit) - a GPU optimized specifically for TensorFlow that can be used on the Google Cloud Engine  TensorFlow Lite - a TensorFlow low weight version to run on Android and make developer's lives easier Last week, at a BigData meetup in Chicago, I discovered that Nvidia also created a specific GPU hardware for processing Deep Learning, the Tensor Core .  With all this infrastructure and APIs being made available, Deep Learning can be done considerably easier and faster. At Go...

Errors when using the neuralnet package in R

Image
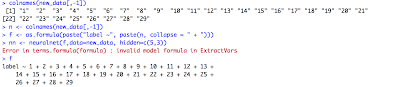
Ok, so you read a bunch of stuff on how to do Neural Networks and how many layers or nodes you should add, and etc... But when you start to implement the actual Neural Networks you face a ton of dummy errors that stop your beautiful inspirational programming. This post talks about some errors you might face when using the neuralnet package in R. First, remember, to use the package you should install it: install.packages("neuralnet") Then library(" neuralnet") to load the package. Error 1 One error that might happen training your neural network is this: nn <- neuralnet(formula1,data=new_data, hidden=c(5,3)) Error in terms.formula(formula) : invalid model formula in ExtractVars This happens when the name of the variables in formula "formula1" are in a non desired format. For example if you named your columns (or variables) as numbers you would get this error. So change your column names and re-run the model! Example: label ~ 1 ...

Running k-Means Clustering on Spark with Cloudera in your Machine

Image
Here are some steps to start using Spark. You can download a VirtualBox and a Cloudera Hadoop distribution and start testing it locally on your machine. Steps : Download kmeans.py example that uses MLLIB furnished by Spark. Create a kmeans_data.txt file that looks like this: 0.0 0.0 0.0 0.1 0.1 0.1 0.2 0.2 0.2 9.0 9.0 9.0 9.1 9.1 9.1 9.2 9.2 9.2 Download VirtualBox . Download Cloudera CDH5 trial version. Open VirtualBox, import the downloaded Cloudera's Virtual Box and run it. Inside VirtualBox: 1 - (needs internet access) Install python numpy library. In a terminal, type: $ sudo yum install numpy 2 - Copy kmeans_data.txt and kmeans.py to /home/cloudera/ (or wherever you want) 3 - Launch Cloudera Enterprise Trial by clicking on an icon on Cloudera's Desktop or run this command: $ sudo cloudera-manager --force --enterprise 4 - Open Cloudera Manager Webinterface on your browser. Here are the credentials for that: user:...

Error when using smooth.spline

When trying to interpolate a series of data the cubic spline  is a great technique to be used. I choose to use the smooth.spline function, from the R stats package. > smooth.spline(data$x,  data$y ) Nevertheless, while running smooth.spline on a collection of datasets with different sizes I got the following error: Error in smooth.spline( data$x,  data$y),  :   'tol' must be strictly positive and finite After digging a little bit I discovered that the problem was that some datasets were really small and smooth.spline wasn't being able to compute anything. Hence, make sure your dataset is big enough before applying smooth.spline to it. > if(length(data$x) > 30) {  smooth.spline( data$x,  data$y)  } UPDATE:  A more generalized solution would be: > if(IQR(data$x) > 0) {  smooth.spline( data$x,  data$y)  }

Working with Big Datasets in R

When dealing with a significant amount of data in R the are some points to consider. How do I know if my data is too big? Well, the term "BigData" can be thought of as a data that is too big to fit in the available memory. As R works with the entire dataset in memory (unless you specify it not to do so), the first thing is to check how large is the dataset in question, and if it does fit in memory . Remember that you actually should have at least double memory of the size of your dataset. So for example if you dataset has a size of 2 GB, you should have at least 4 GB of memory. If you don't have enough memory, you should consider breaking your data into smaller chunks and working with them separately. You can use the command split to do this in Linux: split -l 10000 file.txt new_file This should create several new files (new_filea, new_fileb, etc..) with ten thousand lines each. Well, once you know your date will fit into memory, you can read it with th...

Removing Outliers to Plot Data

I am currently working a lot with R . One simple thing that helps me to better visualize data is to plot it excluding outliers. To do so, first read the data data = read.table(“myfile.txt”)                                      Then, you can check how data is distributed quantile(data, c(.02, .05, .10, .50, .90, .95, .98))                 An example output would be    2%   5%  10%  50%  90%  95%  98%   189  190 190  194  241  275  316  Now,  to plot your data discarding the 1% lowest values and 1% higher values, you could use x <- quantile(data, c(.01, .99))                                    And then plot(data, xlim=c(x[[1]], x[[2]])) ...

SVM in Practice

Image
Many Machine Learning articles and papers describe the wonders of the Support Vector Machine (SVM) algorithm. Nevertheless, when using it on real data trying to obtain a high accuracy classification, I stumbled upon several issues. I will try to describe the steps I took to make the algorithm work in practice. This model was implemented using R and the library "e1071". To install and use it type: > install.packages("e1071") > library("e1071") When you want to classify data in two categories , few algorithms are better than SVM. It usually divides data in two different sets by finding a "line" that better separates the points. It is capable to classify data linearly (put a straight line to differentiate sets) or do a nonlinear classification (separates sets with a curve). This "separator" is called a hyperplane . Picture 1 - Linear hyperplane separator Normalize Features Before you even start running the algor...